I realize we still have a few months left to go before 2006 ends. However, since my "off" season officially began last week, I decided to do this now. So 2006 was 40 weeks for me. It helps for me because the graphs don't lie. I can really see where my weaknesses are, why they're weak, and what to do about it.
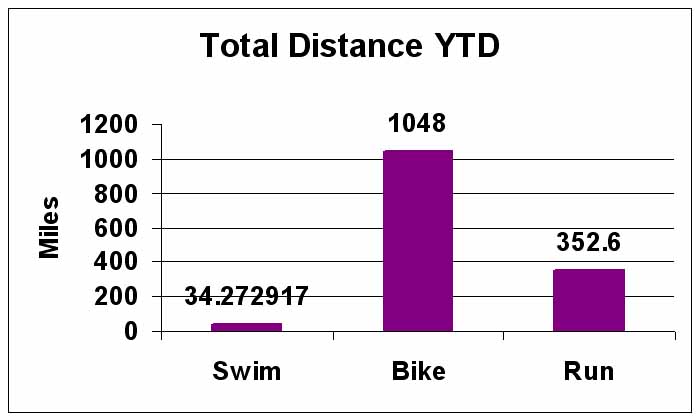
First, there's total distance, summed up for the year. These numbers are pretty much meaningless. However, it's cool to think that I biked 1048 miles in 2006. And ran 352.6. And swam 34. In addition, the proportions are good--I'm biking the most, running in the middle, and swimming the least. However, I need to bump the swimming up...a lot (as supported by the other graphs, as well).
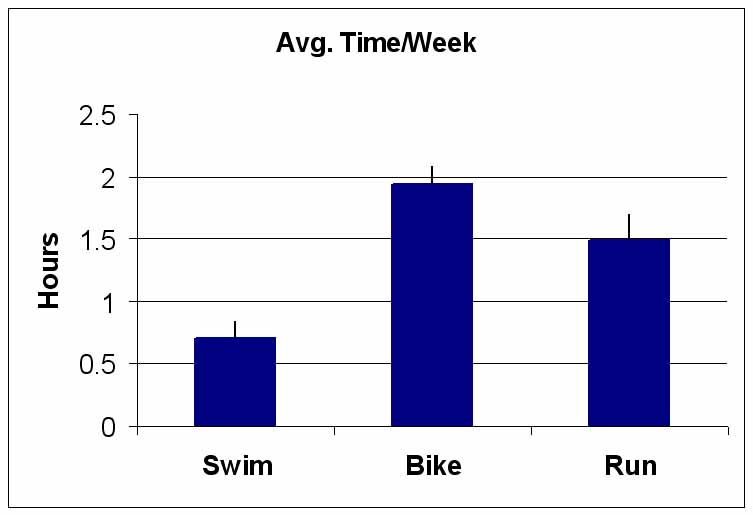
Then, there's average time and distance per week (with error bars). It's nice to get one large picture of everything. Again, I can see the proportions are correct. And that I need to get in the pool more. On average, my workout time was 4-5 hours per week. This, of course accounts off weeks and recovery weeks as well as the heavy volume weeks so it's a very broad overview. But it looks like I'm spending less than an hour a week in the pool, which needs to change. Can anyone guess which sport is my least favorite? I think it's just b/c the biking and running are easier to do and easier to fit into my schedule. No more excuses for 2007! However, I am happy with the biking since I used to be a running fiend (which was not good for my knees). This explains why I've gotten faster on the bike. Hmmm. I'm onto something here. Do more of something, get better at it. What a concept! Overall, I guess I wish these numbers were higher. However, I was coming back from complete inactivity at the beginning of 2006 and had to start from somewhere. Maybe the week-to-week graphs will give a better illustration.

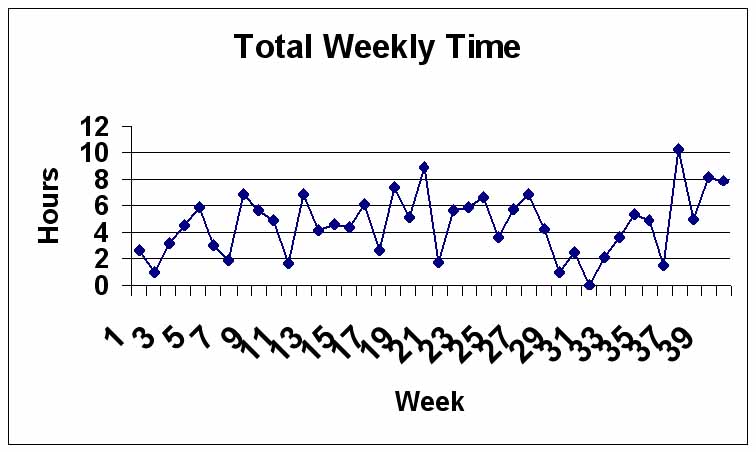
Next up, total weekly time and distance. Actually, I kind of like it. I like how I consistently back down on the training volume every 4th week or so. Good for recovery. In addition, there was a steady increase in time and volume over the season as my fitness returned. The "crash" between wks 29 and 35 coincide with the diagnosis of the low thyroid. So there you go. And weeks 36-40 are after thyroid treatment begun. It's like a study for the effectiveness of thyroid replacement therapy! Anyway, the 'roids are working. Got my TSH tested last week, and it was 3. This is good! Very good!

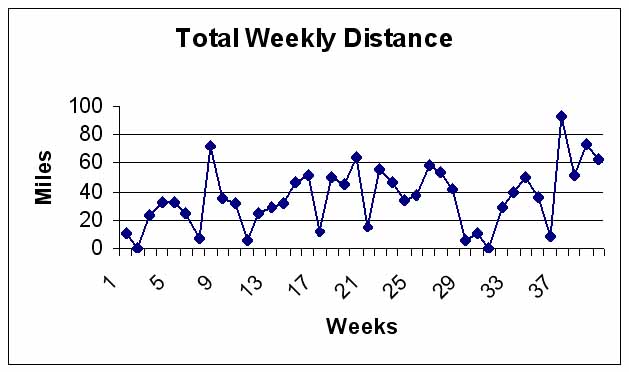
And finally, the breakdown for each sport by week. Verrry interesting. I need to: GET IN THE POOL!

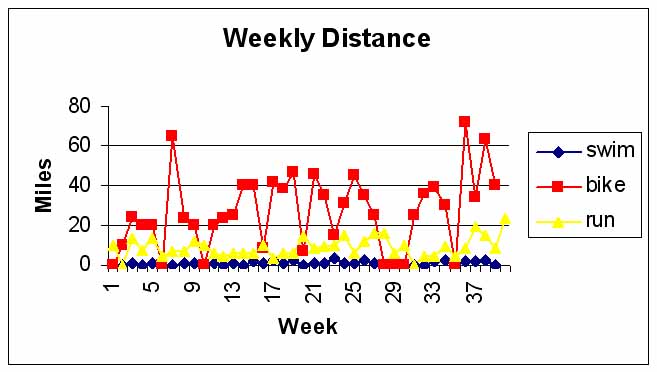
Everything seems very obvious now. Last season, running was my strongest, cycling was in the middle, and swimming was my weakest. Last season, I was running the most. This season, I've been biking more, which is good since triathlon emphasizes the cycling leg. However, my running has slowed down, and it's easy to see why. Less mileage. May be time to gradually build it back up. Most importantly, I can see why I feel so sluggish in the water: not enough TIME in the water. Endurance is very sport-specific, and I think this demonstrates just that. Well, at least now I know what I have to do.
11 comments:
Love the graphs. Have you ever considered putting the swimming yardage on a second set of axes?
Wow, you have been very thorough in your record keeping- I'm impressed!
Don't worry, master's practice will increase that yardage FAST!
Jodi
That is impressive, it's nice to have something to look at for all your progress!
Ooh! Pretty graphs! Have you thought about creating a weight system for the swimming, biking, and swimming either based on which is your strongest/weakest skill or it's percentage in races?
Nice summary! What are you using to graph and track your training?
Geek..i gotta learn how to do that too.
I would focus more on time than volume.
What I notice is that I am ever becoming more efficient.
Biking for example, last year I am around 27-28 kph (18 mph?). Now I am reaching 28-32 kph (19 mph?) with the same intensity.
Mmmmmmm, charts!
I was reading an article where a long time runner finally got her run PRs by swimming more! That really interested me. She said that swimming is very aerobic, and got a lot of her aerobic conditioning in the pool...
What I'm thinking, is if I can keep drilling, and counting strokes for efficiency, and build aerobic capacity in the pool, it might help me get my swim on more in '07.
Plus, I'm tired of chasin' swim champs down on the bike. I want to get out of the water with them, and then make them SUFFER trying to keep up on the bike!
The scientist in me loves the graphs, but definitely you need to weight the averages according to either time/difficulty rather than raw miles. Kinda comparing apples to oranges with the biking and the swimming.
Great to see that you are still doing really well after a year out there.
Later,
Seth
Love the graphs. You never know what is going on unless you can see it from a big picture perspective. As you are flipping through pages of data (via physical or electronic) it is hard to see but the graphs help a lot.
What are you using? I was thinking of putting everything in Excel and doing graphs from there.
Murtha...
balance is key...too bad I haven't figured that out yet :P Which sport do you enjoy the most? That's the one I would spend the most time on.
It's Excel. Yeah, I obviously need to figure out how to "weight" everything. Any tips on exactly how to do that instead of doing raw mileage? Time-wise though, I think it's a fair comparison.
Zoo--I enjoy running the most, which is exactly why I shouldn't do it the most. I should do the sport I enjoy the least the most so I can exploit my weaknesses. Love thy enemy!
Post a Comment